Math Score

This graph really shows my score in math because it shows how I increased my score on the MAP tests from last year. Then it goes down because I have not taken the next year's tests. I think this is the best graph because it shows my score in a simple way.
Language Score

This graph may be kind of complicated because it doesn't show immediately my score, but at least it shows my results in my MAP tests.
Reading Score
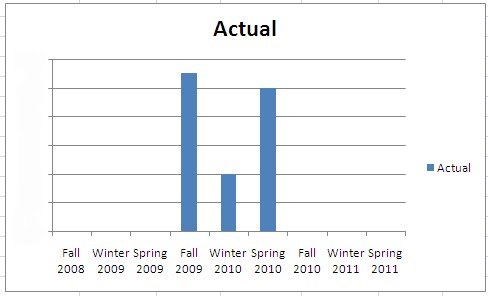 This is a very simple graph. It shows my results and how I changed them by the pass of the year.
No comments:
Post a Comment